
Loading the context…
Loading the context…
Reported Oct 6, 2026Quickanomics write-up updated Oct 11, 2026, version 43 min read
Follow the developing storyExpanded original Quickanomics reporting with the source’s material findings, comparisons and qualifications at all three reading depths.
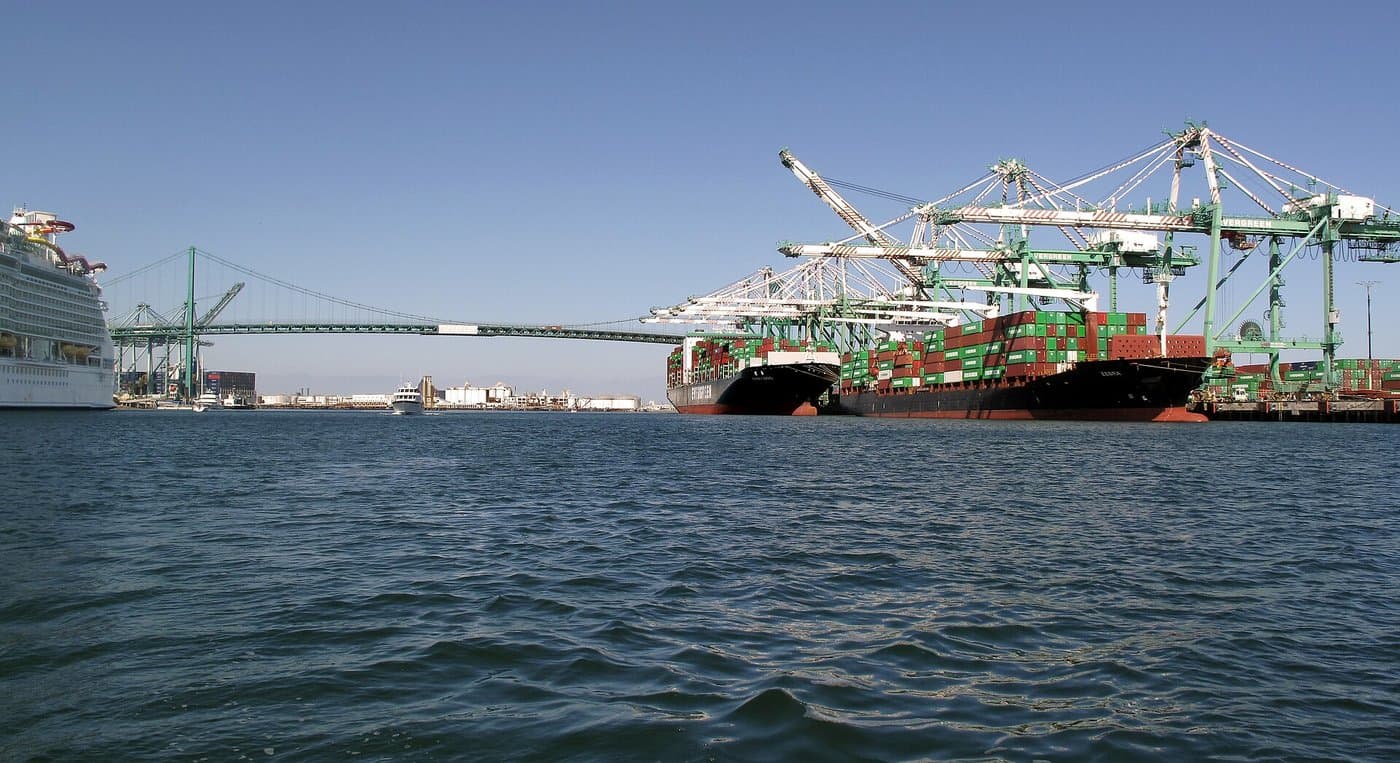
August’s wider trade gap was concentrated in goods, while year-to-date figures still showed a narrower deficit than in 2025.
The US goods-and-services trade deficit widened by US$12.7 billion to US$105.6 billion in August, the BEA reported. July’s gap was revised to US$92.8 billion.
Exports increased US$4.5 billion to US$315.2 billion, but imports rose US$17.2 billion to US$420.8 billion. The goods deficit increased US$12.8 billion to US$136.6 billion. The services surplus was US$31 billion, with a change of less than US$0.1 billion.
That monthly deterioration differs from the year-to-date comparison. The deficit over the year to date was US$138.2 billion, or 19.9 per cent, smaller than in the same period of 2025. Exports increased US$267.7 billion, or 11.8 per cent, while imports rose US$129.5 billion, or 4.4 per cent.
The three-month average deficit rose US$9.9 billion to US$89.9 billion, with average exports down US$1.6 billion to US$314.4 billion and imports up US$8.3 billion to US$404.3 billion. Against a year earlier, the average deficit was US$25.4 billion larger; exports were US$31.1 billion higher and imports US$56.5 billion higher. These different windows are necessary to interpret the direction of the change.
Goods exports increased US$4.4 billion to US$205.7 billion. Industrial supplies rose US$6.3 billion, including US$2.3 billion more gold, US$2 billion more crude oil and US$1.2 billion more fuel oil. Capital goods rose US$1.3 billion, with semiconductors up US$1 billion and computers and accessories each up US$0.9 billion, while aircraft fell US$1 billion.
Consumer goods exports fell US$2.2 billion, including a US$2.4 billion decline in pharmaceuticals. The category movements show why the overall export increase cannot be described as uniform across goods.
Goods imports rose US$17.2 billion to US$342.2 billion. Industrial supplies increased US$9.1 billion, including crude oil up US$3.3 billion and gold up US$3.1 billion. Capital goods rose US$6.2 billion, with semiconductors up US$2.4 billion and machinery up US$1.3 billion, while computer accessories fell US$1.6 billion.
Services exports increased by less than US$0.1 billion to US$109.5 billion. Intellectual-property charges rose US$0.2 billion and other business services US$0.1 billion, while travel fell US$0.2 billion and financial services US$0.1 billion. Services imports rose by less than US$0.1 billion to US$78.5 billion, with transport up US$0.4 billion, intellectual-property charges down US$0.2 billion and travel down US$0.1 billion.
On an inflation-adjusted Census basis in 2017 dollars, the goods deficit rose US$8.7 billion, or 8.2 per cent, to US$114.7 billion. The nominal increase was 11.1 per cent. Real exports rose US$1.9 billion, or 1.3 per cent, to US$153 billion; real imports rose US$10.7 billion, or 4.1 per cent, to US$267.7 billion. The corresponding nominal growth rates were 2.1 and 5.4 per cent.
Real and nominal changes differ because the real series adjusts for prices. The real goods figures also carry a separately identified Census basis, while the headline goods-and-services figures use the seasonally adjusted balance-of-payments account.
Reported bilateral goods deficits included Mexico at US$27.7 billion, Vietnam US$24 billion, Taiwan US$18.3 billion, China US$16.4 billion and the EU US$11 billion. Canada’s deficit rose US$4.1 billion to US$7.1 billion, with exports up US$0.5 billion to US$29.9 billion and imports up US$4.6 billion to US$37.1 billion.
Singapore shifted from a US$1.9 billion surplus to a US$0.3 billion deficit. Ireland’s deficit declined US$1.5 billion to US$2.5 billion. These partner results describe parts of goods trade, not the entire services-inclusive balance.
July goods imports were revised up US$4.4 billion and exports US$0.2 billion; services exports and imports were each revised down US$0.2 billion. September trade was scheduled for release on November 4.
The trade deficit records imports exceeding exports in this account. It is neither the fiscal deficit nor a complete assessment of the benefits and costs of international trade.
Reports from the same original source are not independent confirmation.
The BEA reports an August 2026 US goods-and-services trade deficit of US$105.6 billion, up US$12.7 billion from July’s revised US$92.8 billion. Exports rose US$4.5 billion to US$315.2 billion and imports rose US$17.2 billion to US$420.8 billion.
The BEA reports an August 2026 US goods-and-services trade deficit of US$105.6 billion, up US$12.7 billion from July’s revised US$92.8 billion. Exports rose US$4.5 billion to US$315.2 billion and imports rose US$17.2 billion to US$420.8 billion.Bureau of Economic Analysis: U.S. International Trade in Goods and Services, August 2026
The goods deficit increased US$12.8 billion to US$136.6 billion, while the services surplus was US$31 billion with a change of less than US$0.1 billion.
The goods deficit increased US$12.8 billion to US$136.6 billion, while the services surplus was US$31 billion with a change of less than US$0.1 billion.Bureau of Economic Analysis: U.S. International Trade in Goods and Services, August 2026
The year-to-date deficit was US$138.2 billion, or 19.9 per cent, smaller than in the same period of 2025. Exports increased US$267.7 billion, or 11.8 per cent, and imports US$129.5 billion, or 4.4 per cent over that comparison.
The year-to-date deficit was US$138.2 billion, or 19.9 per cent, smaller than in the same period of 2025. Exports increased US$267.7 billion, or 11.8 per cent, and imports US$129.5 billion, or 4.4 per cent over that comparison.Bureau of Economic Analysis: U.S. International Trade in Goods and Services, August 2026
The three-month average deficit increased US$9.9 billion to US$89.9 billion; average exports fell US$1.6 billion to US$314.4 billion and imports rose US$8.3 billion to US$404.3 billion. Compared with a year earlier, the average deficit was US$25.4 billion larger, exports US$31.1 billion higher and imports US$56.5 billion higher.
The three-month average deficit increased US$9.9 billion to US$89.9 billion; average exports fell US$1.6 billion to US$314.4 billion and imports rose US$8.3 billion to US$404.3 billion. Compared with a year earlier, the average deficit was US$25.4 billion larger, exports US$31.1 billion higher and imports US$56.5 billion higher.Bureau of Economic Analysis: U.S. International Trade in Goods and Services, August 2026
Goods exports rose US$4.4 billion to US$205.7 billion. Industrial supplies rose US$6.3 billion, including gold US$2.3 billion, crude oil US$2 billion and fuel oil US$1.2 billion; capital goods rose US$1.3 billion, including semiconductors US$1 billion, computers US$0.9 billion and accessories US$0.9 billion, while aircraft fell US$1 billion. Consumer goods fell US$2.2 billion, including pharmaceuticals US$2.4 billion.
Goods exports rose US$4.4 billion to US$205.7 billion. Industrial supplies rose US$6.3 billion, including gold US$2.3 billion, crude oil US$2 billion and fuel oil US$1.2 billion; capital goods rose US$1.3 billion, including semiconductors US$1 billion, computers US$0.9 billion and accessories US$0.9 billion, while aircraft fell US$1 billion. Consumer goods fell US$2.2 billion, including pharmaceuticals US$2.4 billion.Bureau of Economic Analysis: U.S. International Trade in Goods and Services, August 2026
Goods imports rose US$17.2 billion to US$342.2 billion. Industrial supplies increased US$9.1 billion, including crude oil US$3.3 billion and gold US$3.1 billion. Capital goods rose US$6.2 billion, with semiconductors up US$2.4 billion and machinery US$1.3 billion, while computer accessories fell US$1.6 billion.
Goods imports rose US$17.2 billion to US$342.2 billion. Industrial supplies increased US$9.1 billion, including crude oil US$3.3 billion and gold US$3.1 billion. Capital goods rose US$6.2 billion, with semiconductors up US$2.4 billion and machinery US$1.3 billion, while computer accessories fell US$1.6 billion.Bureau of Economic Analysis: U.S. International Trade in Goods and Services, August 2026
Services exports rose less than US$0.1 billion to US$109.5 billion, with intellectual-property charges up US$0.2 billion and other business services US$0.1 billion, while travel fell US$0.2 billion and financial services US$0.1 billion. Services imports rose less than US$0.1 billion to US$78.5 billion, with transport up US$0.4 billion, intellectual-property charges down US$0.2 billion and travel down US$0.1 billion.
Services exports rose less than US$0.1 billion to US$109.5 billion, with intellectual-property charges up US$0.2 billion and other business services US$0.1 billion, while travel fell US$0.2 billion and financial services US$0.1 billion. Services imports rose less than US$0.1 billion to US$78.5 billion, with transport up US$0.4 billion, intellectual-property charges down US$0.2 billion and travel down US$0.1 billion.Bureau of Economic Analysis: U.S. International Trade in Goods and Services, August 2026
The inflation-adjusted goods deficit on the Census basis in 2017 dollars rose US$8.7 billion, or 8.2 per cent, to US$114.7 billion, compared with an 11.1 per cent nominal increase. Real goods exports rose US$1.9 billion, or 1.3 per cent, to US$153 billion versus 2.1 per cent nominal growth; real imports rose US$10.7 billion, or 4.1 per cent, to US$267.7 billion versus 5.4 per cent nominal growth.
The inflation-adjusted goods deficit on the Census basis in 2017 dollars rose US$8.7 billion, or 8.2 per cent, to US$114.7 billion, compared with an 11.1 per cent nominal increase. Real goods exports rose US$1.9 billion, or 1.3 per cent, to US$153 billion versus 2.1 per cent nominal growth; real imports rose US$10.7 billion, or 4.1 per cent, to US$267.7 billion versus 5.4 per cent nominal growth.Bureau of Economic Analysis: U.S. International Trade in Goods and Services, August 2026
Reported bilateral goods deficits included Mexico US$27.7 billion, Vietnam US$24 billion, Taiwan US$18.3 billion, China US$16.4 billion and the EU US$11 billion. The Canada deficit increased US$4.1 billion to US$7.1 billion as exports rose US$0.5 billion to US$29.9 billion and imports US$4.6 billion to US$37.1 billion.
Reported bilateral goods deficits included Mexico US$27.7 billion, Vietnam US$24 billion, Taiwan US$18.3 billion, China US$16.4 billion and the EU US$11 billion. The Canada deficit increased US$4.1 billion to US$7.1 billion as exports rose US$0.5 billion to US$29.9 billion and imports US$4.6 billion to US$37.1 billion.Bureau of Economic Analysis: U.S. International Trade in Goods and Services, August 2026
The Singapore balance shifted from a US$1.9 billion surplus to a US$0.3 billion deficit, while the Ireland deficit fell US$1.5 billion to US$2.5 billion.
The Singapore balance shifted from a US$1.9 billion surplus to a US$0.3 billion deficit, while the Ireland deficit fell US$1.5 billion to US$2.5 billion.Bureau of Economic Analysis: U.S. International Trade in Goods and Services, August 2026
July’s goods imports were revised up US$4.4 billion and goods exports up US$0.2 billion; services exports and imports were each revised down US$0.2 billion. The headline goods-and-services account uses seasonally adjusted balance-of-payments figures; real goods figures are identified separately on a Census basis.
July’s goods imports were revised up US$4.4 billion and goods exports up US$0.2 billion; services exports and imports were each revised down US$0.2 billion. The headline goods-and-services account uses seasonally adjusted balance-of-payments figures; real goods figures are identified separately on a Census basis.Bureau of Economic Analysis: U.S. International Trade in Goods and Services, August 2026
The next release for September trade was scheduled for November 4, 2026. A trade deficit measures imports exceeding exports in the defined account; it is not itself the fiscal deficit or a full measure of national welfare.
The next release for September trade was scheduled for November 4, 2026. A trade deficit measures imports exceeding exports in the defined account; it is not itself the fiscal deficit or a full measure of national welfare.Bureau of Economic Analysis: U.S. International Trade in Goods and Services, August 2026
The headline balance alone does not establish the causes of every trade flow or a sustained trend.
Answers use this article’s sources. They can explain what is known and what is missing.
Sign in to ask a question